Methodology
The DPI Map collects data based on a framework explained below. This framework provides a comprehensive view of the technical and governance characteristics of DPI, studying DPI through a set of attributes and indicators. Given its desk-based data collection methods, the DPI Map gathers data on a limited number of these indicators.
Based on a minimal set of benchmarks that are regarded as characteristics of DPI, we arrived at a “count” for DPI-like systems.
For digital ID systems, we counted if the country claimed to have a digital ID, whether it was active, enabled digital authentication, and was used by 2 more sectors.
For digital payment systems, we counted if the country had a payment system that was active and enabled real-time transactions, and was operated by the central bank wholly or partially.
For data exchange systems, we counted countries with active systems that were designed to exchange data across sectors.
DPI-likeness refers to systems most closely associated with being DPI.
DPI Conceptualisation and Measurement Framework
As governments, multilateral actors, and technology implementers collaborate towards making DPI a reality across the globe, the DPI Map asks: how prevalent is DPI across the planet?
To answer this, we had to wrestle with some fundamental issues. How does one define DPI as a concept? How do you translate any definition into foundational qualities that can be objectively measured across different national contexts around the world? This piece seeks to explain our approach in addressing these questions, to enable researchers, technical advisors, policymakers and advocates to understand the context of this data set and its limits, so they can effectively use it in their work.
The resulting ‘Measuring DPI Framework’, offers a first take on translating the normative concept of DPI into a measurable framework to evaluate real-world implementations. The framework has two layers (see illustration below). The framework was developed through iterative consultations with experts spread across technical and governance subject matter areas.
The first layer of the framework is inductive. It proposes a set of normative attributes, a set of common technological and governance qualities that describe how DPIs should be designed. The second layer is deductive. It is composed of a set of outcome indicators that describe how attributes can be realised in real-world deployments.
The framework identifies six attributes
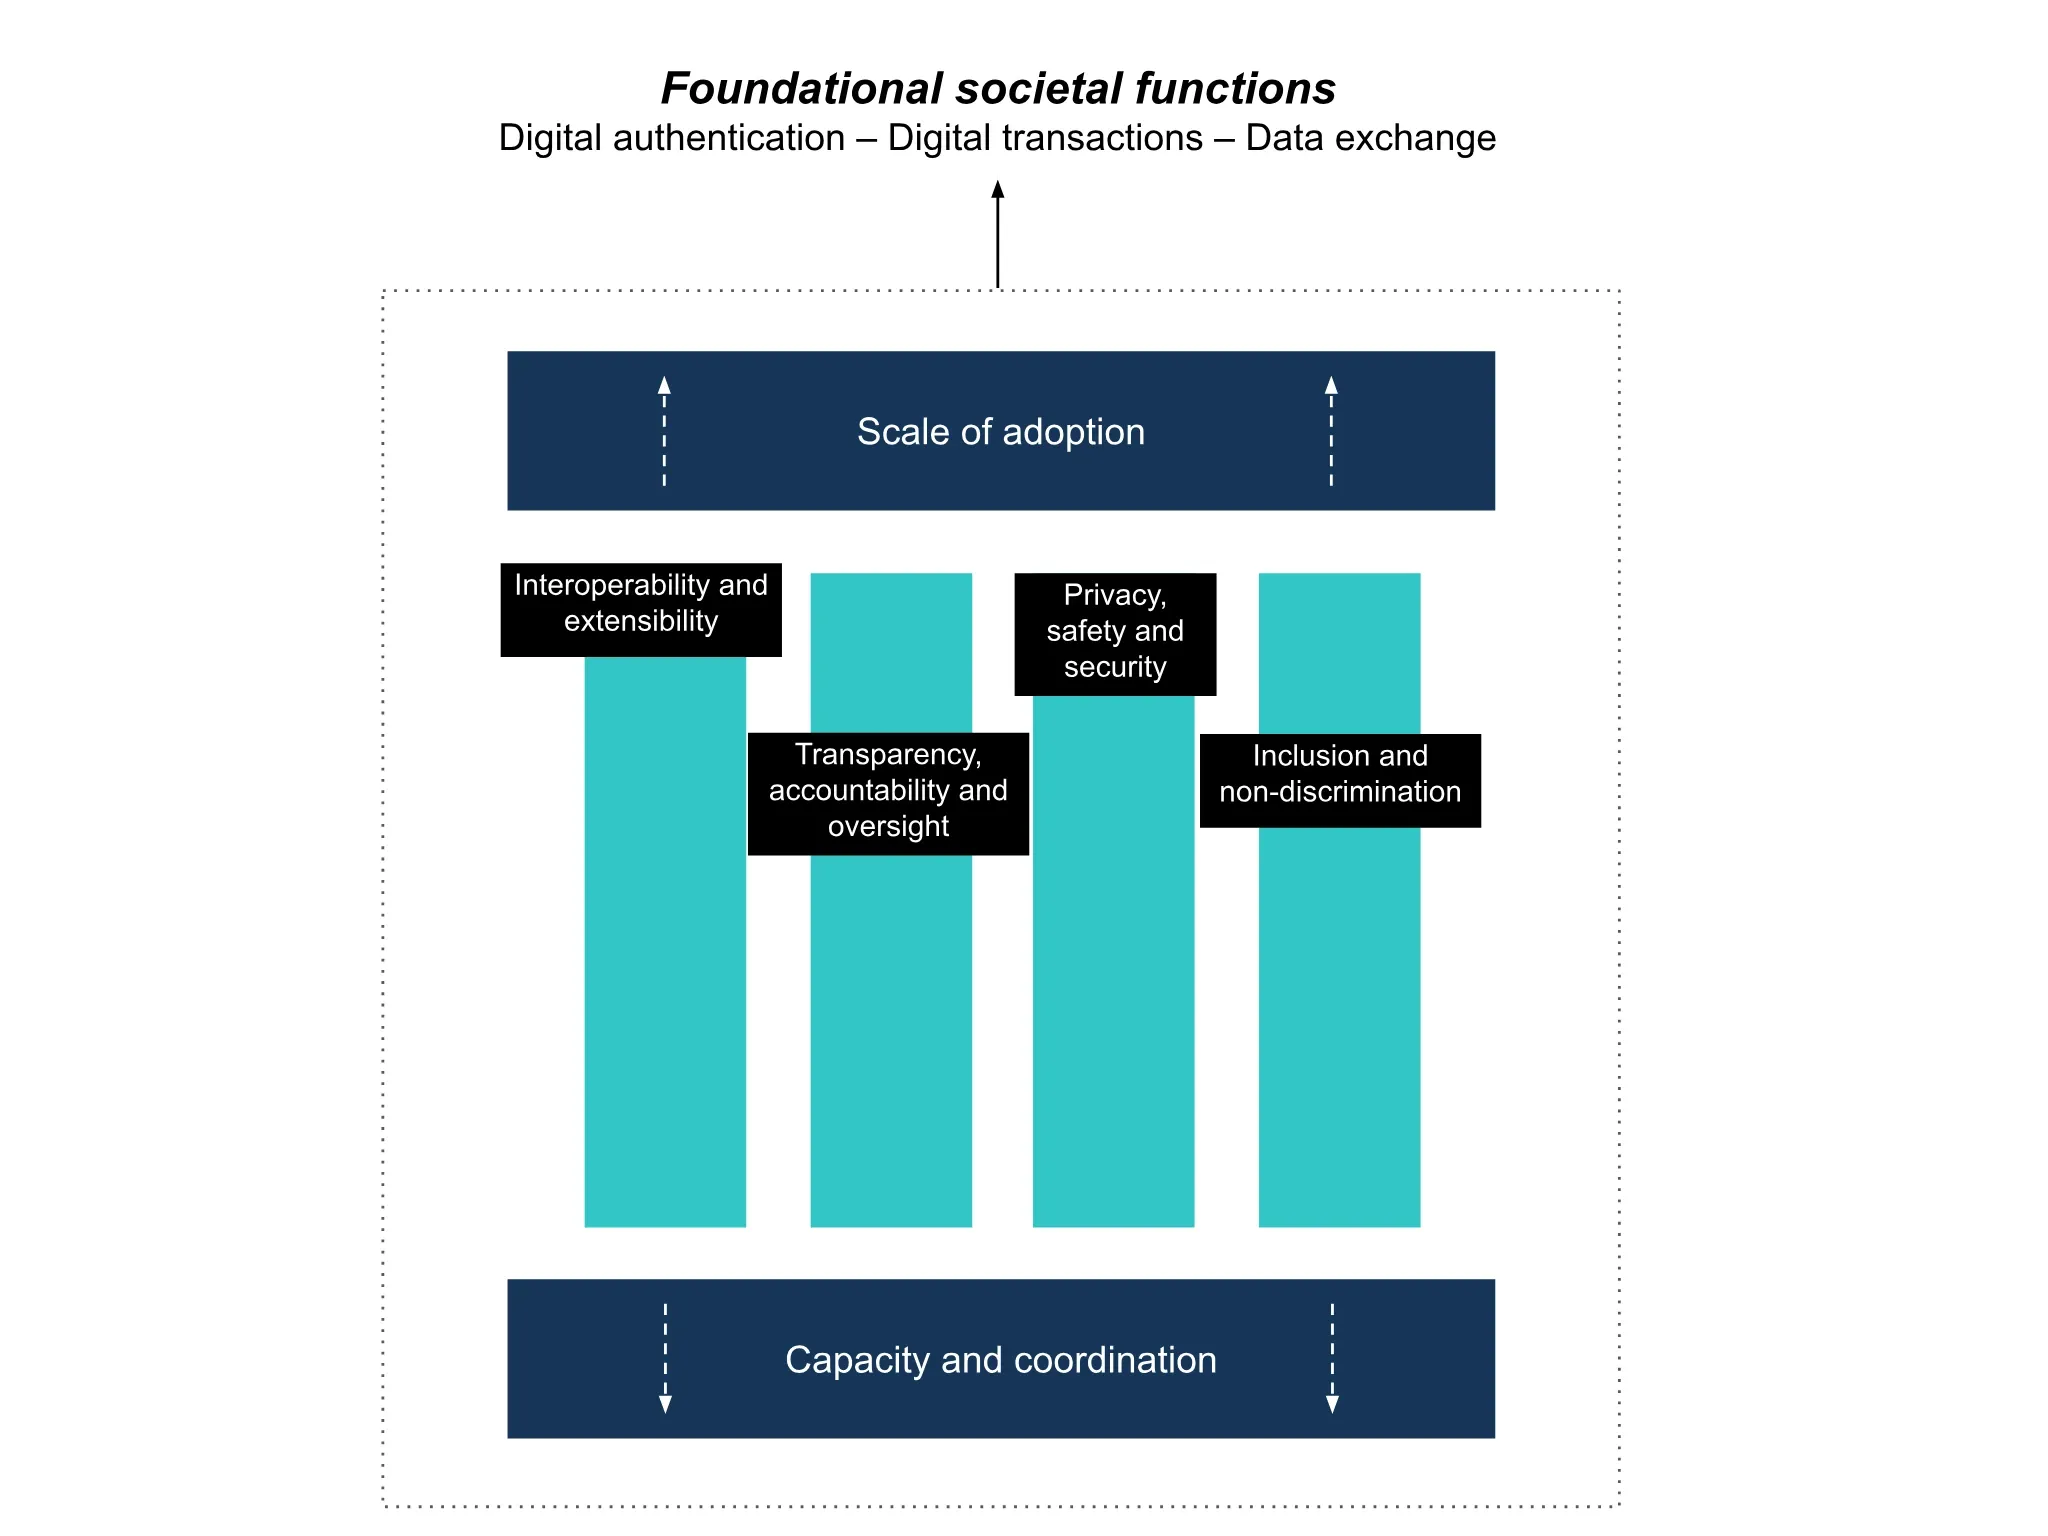
These attributes describe the qualities that define artefacts - like digital identity systems - as public (and not private) infrastructures. In addition to the four attributes, an essential condition to implementing DPI is the supportive ecosystem capacity and coordination capability. A final component for assessing DPI’s attributes is through the adoption of DPI, or the extent to which actors other than the DPI operator leverage the DPI.
These attributes should be read in framing DPI as the means to serve foundational societal functions in the digital age, namely digital authentication, digital transactions and the exchange of data.
To assess the attributes of real-world deployments, the DPI Mapping team had to determine: how do we know if DPI is interoperable? Do we look at its technical standards, or whether the architecture is made accessible through documentation? Or both?
The resulting set of outcome indicators sought to elaborate on the attributes by describing effective norms, rules, technologies and processes observed in real-world deployments and suggested by expert practitioners and area specialists (e.g. privacy and security experts).
Each foundational DPI (i.e. ID, payments, data exchange) has both unique and shared indicators. (38 for ID, 20 for payments, 20 for data exchange).
It’s worth mentioning that not all indicators are equal.
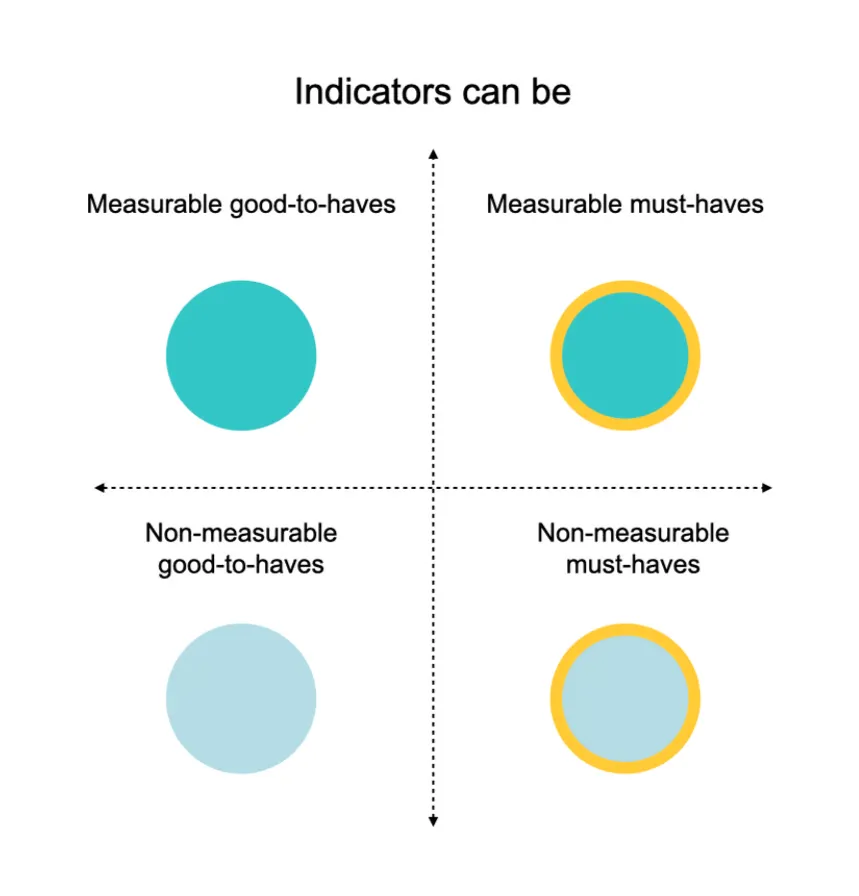
In version 1.0 of this framework, we present an exhaustive version of indicators for all attributes. These indicators however can be divided into subjective and objectively measurable (based on our data scoping methods, accessible here). We further divided indicators into two other categories: ‘must haves’ referred to indicators that more directly assessed the essence of an attribute, while ‘good to haves’ reflected those that did so more indirectly or partially. In an effort to both be more objective and make effective use of our limited resources, version 1.0 of our map collects data on only measurable must-have indicators.
We purposely share all the indicators we derived for several reasons. First, we hope users and contributors might suggest edits that would shift non-measurable indicators into being measurable. Second, that our list of indicators might inform others’ research. And third, just because an indicator is non-measurable does not mean it is not important. We hope that policymakers and DPI developers will find all our indicators useful when developing or deploying DPIs.
Using the framework
We hope that researchers, policymakers, technical advisors, and advocates will use this framework to advise and inform the measurement of DPI as a concept. A complete list of works consulted directly or indirectly in developing this framework will be accessible in our upcoming whitepaper. Feedback is welcome and will be integrated with subsequent versions.
Download the framework (.xls) here.
Download the codebook to understand how the Map uses this framework here.
Download the PDF here
Citation
Eaves, D. and Rao, K. (2025). Digital Public Infrastructure: a framework for conceptualisation and measurement. UCL Institute for Innovation and Public Purpose, Working Paper Series (IIPP WP 2025-01). Available at: https://www.ucl.ac.uk/bartlett/sites/bartlett/files/dpi_conceptualisation_and_measurement.pdf
Data collection methodology
The DPI Map puts the ‘Measuring DPI’ framework to the test, reporting a mix of data points from publicly accessible data sources. Typically, these sources include government-reported updates through their websites, press releases, as well as data from other third-party reporters (World Bank, UN, regional development banks, regional technical capacity-builders).
Since the release of the first version of our Map, we have also received data from country-level implementers and advisors, on the state of their country’s DPI. These have since been validated and included in the dataset as well.